WORLD HAPPINESS.

Design Type
Data Visualization
Team Size
3
Duration
5 weeks
Process
Iterative
Tools Used
Adobe Illustrator, (R Studio) R Programming
Methods Used
Think Aloud Protocol, Sketching
DATA SOURCE.
The Sustainable Development Solutions Network (SDSN) of the United Nations (UN) has been engaging with people from scientific, political and civic communities to make the world better through sustainable initiatives of which World Happiness Report is one. The report was first published in 2012. The main focus of this visualization is 2017's dataset with supporting datasets from 2015 and 2016. The datasets were sourced from kaggle.
AUDIENCE.
The intention behind World Happiness Visualization is to show users a picture of the world, with relevant information to guide their closer examination of specific countries. They can identify how happiness relates to health care, family bonds, economy, and other factors.
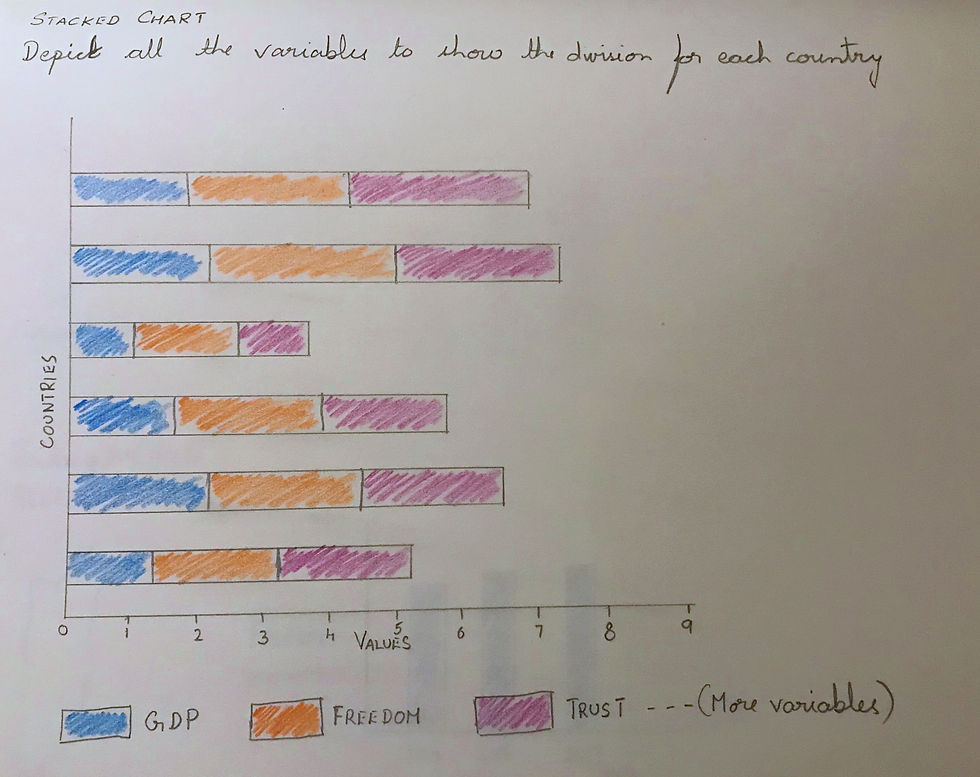
IDEATE.
The ideation process involved sketching on paper various charts.


Iterate.
The sketches formed the base for the construction of charts using R programming mostly using ggplot2 package. The charts were then refined using Adobe Illustrator. A final iteration took place after it was evaluated by the users.
EVALUATE.
Five test users were recruited and were asked to evaluate the charts using the 'Think Aloud' Protocol. Qualitative measures of silent observation, facial expression evaluation, and body language evaluation were utilized in the process. We responded to user questions but refrained from intervening, to keep the invasion minimal.
Final Visualizations.
 |  |
|---|---|
 |  |
 |